Periscope Data - Review, Features, Pricing
Periscope Data Reviews: Overview, User Reviews and Alternatives
Periscope Data touts itself as "the most powerful, flexible analytics platform for data professionals and business users." But is it, really?
With competitors offering viable alternatives (like Looker, Tableau, Chartio and the lightweight, affordable SQLBot), saying you’re “the most powerful, flexible analytics platform for data professionals and business users” is a high claim that warrants a deeper investigation.
We used the platform and found a lot of information about Periscope Data on the internet. But it was hard to get an objective, big-picture view until we compared our experience with hundreds of user reviews.
So pour another cup of coffee, and let’s talk about what we found…
What Is Periscope Data?
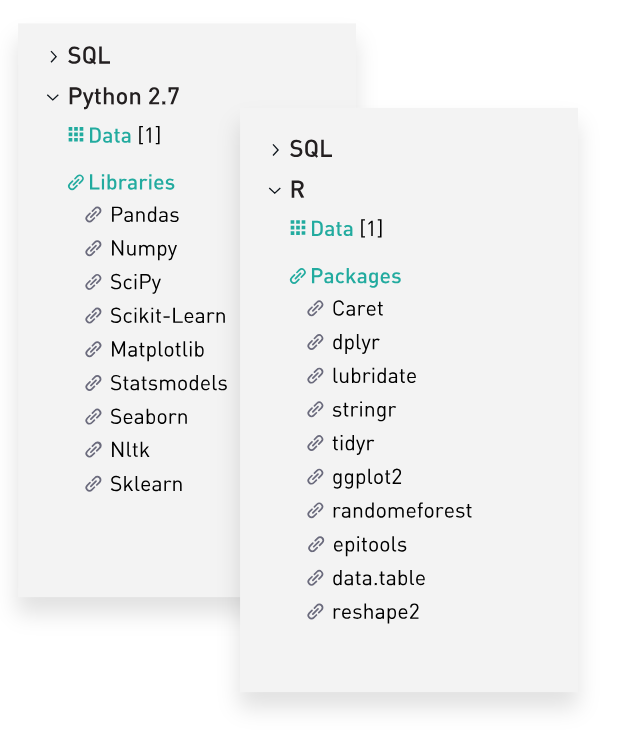
Periscope Data is a software as a service platform that combines the power of SQL, Python and R in one place. It seeks to make vital data and machine learning insights more accessible to the decision makers at your company.
SQL, Python, and R are computer languages used in data science. SQL is for querying and interacting with databases to get information. It’s easy to acquire a basic-level knowledge of this language. Python and R are for using AI and machine learning to analyze, interpret, and present the information gathered from an SQL query.
The problem Periscope claims to solve is easy to understand: Your analytics team is busy writing queries and creating reports and dashboards on business metrics. Each additional information request slows things down, burdening the database (and the BI team), while putting more time between decision makers and the data they need.
That’s a problem.
But what if decision makers could bypass the SQL/AI/analytics gurus to query, analyze, predict and organize vital stats themselves—with only a basic understanding of SQL? Or, what if the data team could respond to information requests exponentially faster?
It would be like having an analytics guru as a CEO, or having a BI team that responds to information requests in a blink of an eye. That would transform any company.
This is what Periscope Data claims to do in its marketing literature, which says:
"[The platform lets] every decision maker run their own data analyses, create and share dashboards and deliver deep insights that drive the business forward. All without learning proprietary data modeling languages or waiting weeks or months for data access.”
But does Periscope Data achieve this? Considering the need for SQL and programming knowledge required to set up and maintain Periscope to its full power and capacity, not exactly... But this shouldn’t discount from the power and value of the platform (when you put it in the hands of an experienced BI pro).
Here's what we think after using the platform and comparing our experience with real user reviews...
Periscope Data Achieves What It Claims (Sort Of)
After reading hundreds of Periscope reviews, we started seeing the same comments again and again. According to the reviews—and our personal experience—Periscope Data is a powerful BI platform that achieves what it claims (sort of).
SQL newbies and decision makers can use the platform to interact with datasets and get predictive insights independently (without the BI team), but only if they have a highly-skilled business intelligence team on the back-end for setup and maintenance. Also, it’s important to remember that—unlike other BI solutions—Periscope requires a data warehouse. These are massive expenses beyond the cost of the platform.
Users agree that Periscope is expensive, but the dashboards and predictive intelligence are worth the cost. Some reviewers complained of bugs, slowdowns and felt the service was not “mature.” But overall, the reviews were glowing when the solution matched the need.
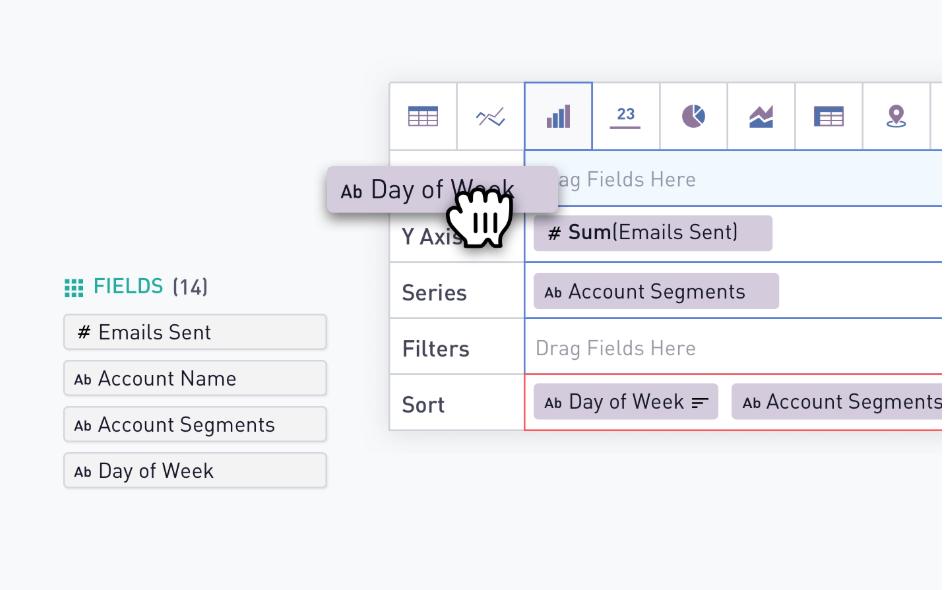
Incidentally, Periscope now offers a drag-and-drop interface that allows beginning coders to drag chunks of code to create queries. It even showcases screenshots of this interface on its website. Nevertheless, user reviews agree that taking advantage of the real power of this software requires a solid foundation in coding by someone in your organization.
The CEO of Periscope Data, Harry Glaser, addressed the need for coding skills when he said:
“If you don't know SQL or you prefer a drag-n-drop interface, I'd hazard that you won't be happy using it.”
Glaser also mentioned a more important reason why people choose not to use Periscope Data:
“You want something less sophisticated for a non-analyst to use in making his or her own simple charts.”
In summary, Periscope Data is built for companies with an experienced analytics team. It’s expensive, but it’s worth the cost when paired with the right organization.
One more thing: Imagine you DON'T NEED expensive machine-learning analytics, whiz-bang dashboards and visuals. But also you’re an SQL wizard, and you want to schedule SQL queries, then automatically push the results of the same query to your team every day, week, month or year (on autopilot).

Periscope Data can do that, but you probably don’t want to pay for all the AI and fancy graphics. In that case, a lighter weight, more affordable solution (like SQLBot) could be a much better match.
Let’s get to the reviews…
What Do Users Say About Periscope Data?
We scoured the web for Periscope Data reviews to help you understand what it’s like. Then we categorized the reviews like this:
- User Experience (Visualizations, Dashboards, Etc.)
- Skill-Level Required / Need for Coding Knowledge
- Cost
- Speed
- Customer Support
- Complaints
- Comparisons to Other Products
Click the links to skip to the different sections.
(1) User Experience, (Visualizations, Dashboards, Etc.)
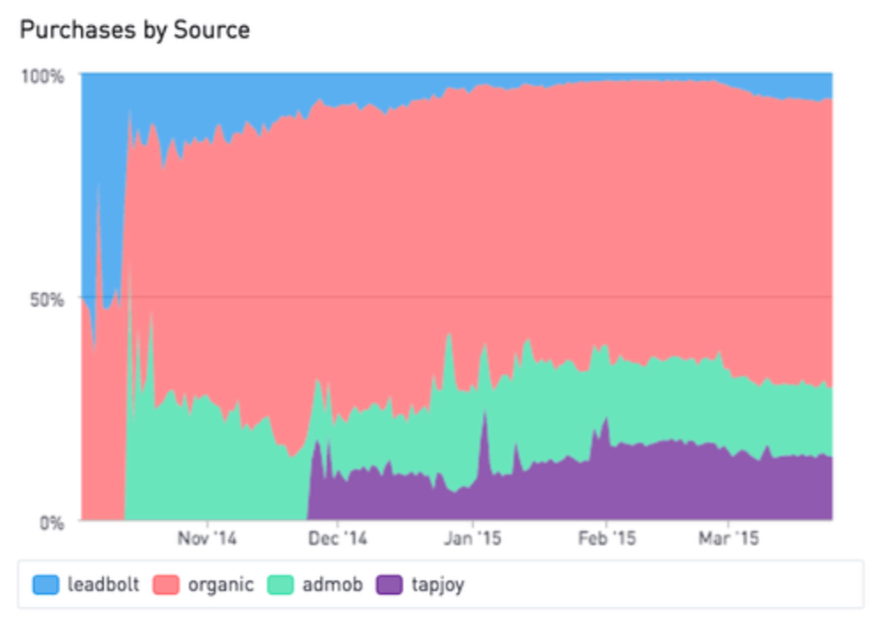
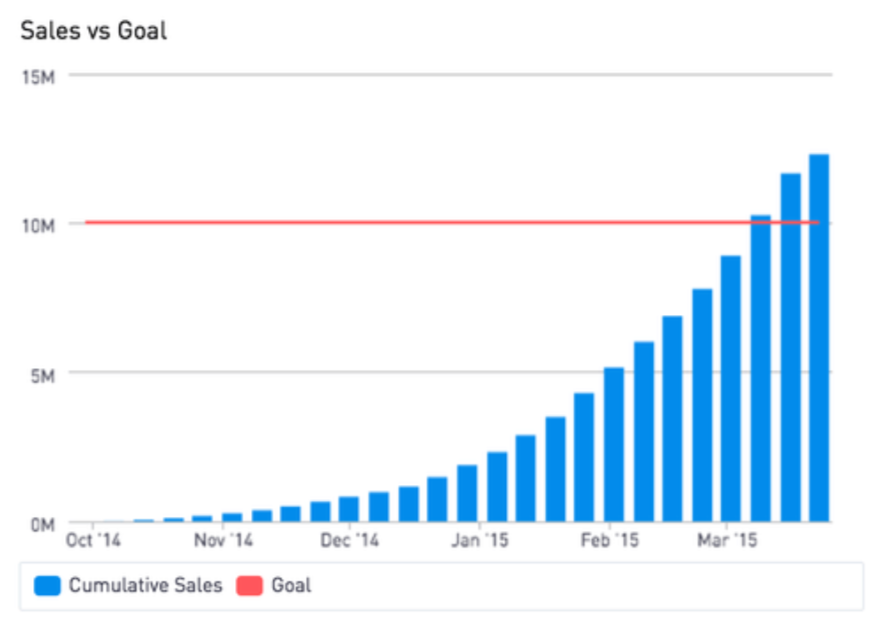
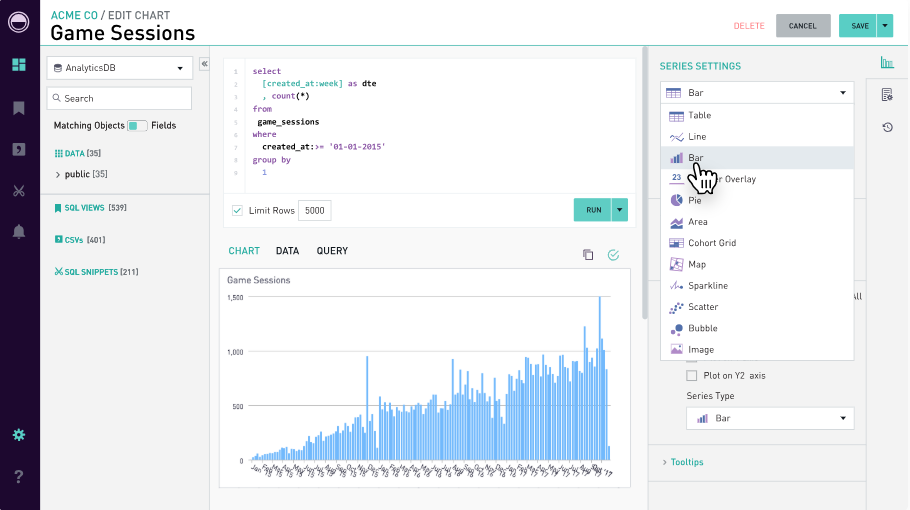
Users love Periscope's dashboards and visualizations, which include heat maps, graphs and other stunning and creative ways to display your data. At the same time, some users complain that the range of “out-of-the-box” visualizations is limited.
To be fair, this complaint probably reflects a lack of skilled SQL, Python and R developers at the organization. As a result, they’re stuck with the basic out-of-the-boxed solutions, which are nice to have, but don’t reflect the deep capabilities of the platform.
Here are the most revealing reviews on user experience and visualizations:
“This is a great product for Visualization. If you know SQL, this is your absolute best friend. IT requires knowledge of SQL, and also to have some sort of strong data input like a warehouse.”
“I don't like the barrier to entry to learn and need to have a data warehouse or a great input.”
- Digital Marketing Specialist in the Services Industry (Gartner), March 22, 2019
“Excellent visualization platform. It is a great way to organize all your analytics onto a single place.”
- Data Developer (Gartner), Aug. 29, 2018
“The range of visualizations that it supports is pretty small. There are design decisions which are probably intentional to help drive speedy dashboard development but limit what you can accomplish in the software.”
“There isn't a great deal of out-of-the-box visualizations available and some of the ones that are maybe shouldn't have shipped yet.”
- Senior Data Scientist in the Services Industry (Gartner), Oct. 15, 2018
“In terms of visualization, the basic set of tools like graphs, pie-charts, pivot tables are extremely slick and sufficient. One can always download CSVs of any output for further Excel manipulations.”
- Bala Parthasarathy, CEO & Co-founder at MoneyTap, Jan. 25, 2017
"Ability to convert SQL directly to beautiful charts and drill down analytics. Email them and share them regularly.”
- Director of Technology and Product Architect (Gartner), Oct. 8, 2018
“The various visualizations offered (pie/line/bar/scatter, moving averages, multiple axes, series) allow almost any data to be turned into an easily understandable graphic … We have many of these dashboards showing on large TV screens above teams' desks.”
“Individuals without SQL training ... can see dashboards upon dashboards of charts and graphs with tons of up-to-date and historical analyses for a given aspect of the business or for a given metric that we are focusing on improving.”
- Full Stack Software Engineer in the Retail Industry (Gartner), March 16, 2019
“I built team-specific dashboards and dashboards tailored for everyone's individual needs and we all seem to have the top-level awareness of performance while also being able to use Periscope's functions to drill down to more granular levels with ease.”
- Daniel W. (G2Crowd), Feb. 9, 2019
“I think that something that Periscope must be improve is the visualizations. Maybe the developers can include more types of charts. Also, that I think that is important is that the tool allow upload information from cvs and allow croos this with tables without cache. [sic]”
- Duvan O. (G2Crowd), Feb. 14, 2019
“Periscope also allows our sales teams to make incredibly data-driven decisions about when and how best to approach customers on cross-sell opportunities and renewals.”
- Shreyans P. (G2Crowd), Jan. 18, 2018
“We can spin up dashboards for every part of our business, making us the most metrics-driven company in our industry. Incredibly powerful to be able to visualize all data about every transaction we ever manage on our platform.”
“Because it's so easy to make these dashboards, we actually do a lot of our work like managing checklists for compliance, reviewing sales pipelines, tracking quota progress, etc. right in Periscope. Super easy to pipe Salesforce data in as well to manage our own data coming out of our app.”
- Ryan P. (G2Crowd), Jan. 20, 2017
(2) Skill-Level Required / Need for Coding Knowledge
Again, reviewers typically agreed that, without knowledge of SQL and without a skilled BI team, Periscope Data will be a challenge, but if you have a wicked BI team and need complex intelligence, you’ll probably love the platform.
The interactive dashboards can help team members design creative dashboards (see screenshots below). Just make sure that you and your team have the necessary skills before you commit to this platform or you could be disappointed.
What Periscope users say about skill level / need for coding knowledge:
“Make sure your BI team is prepared and educated.”
- Marketing Analyst in the Services Industry (Gartner), Oct. 14, 2018
“Periscope has turned much of our organization into dashboard designers. It's pretty cool to see non-analytical people embrace the power of data visualization and get involved in the creation of new dashboards to help power our business.”
- Sr. Associate in the Transportation Industry (Gartner), Feb. 22, 2019
“There is very little hope of having someone without moderate SQL and Periscope variable/view knowledge set up their own chart or even editing an existing chart without potentially creating a flaw in the results or generating a performance bottleneck on the underlying data storage engine. As such, the upkeep and expansion of the tool require technical individuals with reasonably strong SQL knowledge at every step of the way - well beyond the initial set up.”
- Full Stack Software Engineer in the Retail Industry (Gartner), March 16, 2019
“It is a perfect product for a small data team (or even no data team!) to be able to get analytics setup quickly. The built-in features make it extremely easy to allow for any skill level of user to work with it.”
- Data Developer (Gartner), Aug. 29, 2018
“The default templates for the visualizations are limited and a bit basic. There should be a facility to customize the visuals without getting into programming.”
- Director, Partner, CIO in the Transportation Industry (Gartner), Oct. 16, 2018
“I've been using Periscope near-daily for two months now. I love the "type SQL get charts" nature of it, so for somebody like me that's already been well-versed in coding it's an extremely short learning curve to start using it.”
“Jump right into sharing simple dashboards, but hard tasks are hard.”
“If you're comfortable with SQL and one of Python or R, and your pain points are usually about hosting or sharing reports, then Periscope will be very useful to you.”
- Senior Data Scientist in the Services Industry (Gartner), Oct. 15, 2018
“Great dashboarding tool for engineers (knowing SQL).”
“If you are good with SQL, go for it.”
- Director of Technology and Product Architect (Gartner), Oct. 8, 2018
“The SQL learning curve is steep, very steep.”
- Jared B. (G2Crowd), July 31, 2018
“I would just add having Periscope has encouraged a large portion of our previously “non-technical” staff (product managers, ops, finance) to learn basic SQL. It has helped to change our culture to be data-driven.”
- Adam Carley (Quora), Jul 27, 2016
“Periscope does require a good amount of SQL knowledge, which can be picked up but does require practice.”
- Shreyans P. (G2Crowd), Jan. 18, 2018
“They've added an amazing layer of macros that make the hard parts of SQL into no-brainers. You can write regular SQL of course but these macros make it easier to turn marketing guys and product people into basic SQL programmers. This is true democratization of data and now data hungry marketeers and product managers don’t need to rely on techies to fetch them information.”
- Bala Parthasarathy, CEO & Co-founder at MoneyTap, Jan. 25, 2017
(3) Cost
As of 2016, Periscope’s pricing started at $1,000 a month for its most basic users, but its website doesn't indicate current prices. According to Periscope's co-founder in 2016, Periscope wouldn’t raise prices on existing customers. As long as this policy exists, it means that the earlier you sign up for this service the better.
One basic package user wasn't entirely happy with the basic package. He said, that Periscope was just adding "a pretty graph to your MySQL query with some added filters."
On top of Periscope Data's costs, it's important to remember the additional costs of (1) hiring a skilled BI team and (2) maintaining a data warehouse. Plus, if your company plans to take advantage of Periscope's big data and machine learning insights, you can expect your fees to increase dramatically.
For data-driven companies, the high cost of Periscope's predictive, machine learning insights could pay for themselves. On the other hand, if you don’t need AI intelligence or whiz-bang visuals—and if you don't have a skilled BI team—buying Periscope Data could be like owning a Rolls Royce without being able to drive it.
Here’s what users say about the cost of Periscope Data:
“It could be expensive at first but it will be worth it totally.”
- Emilio M. (G2Crowd), Feb. 11, 2019
“When you get into the big data space, the cost begins to climb higher then [sic] expected.”
“Pay attention to your dashboard notifications, as your data grows you're going to be alerted to pay more.”
- Software Engineer in the Services Industry (Gartner), Feb. 14, 2019
“[Did not like the] inability to embed. It’s available for premium but too costly.”
- Director of Technology and Product Architect (Gartner), Oct. 8, 2018
“We use it - it is now $1,000. It used to start at $500 for 20mm rows, but they didn’t enforce this. If they did, we would cancel. Right now, at $500 the service is overpriced for us. We aren’t using their data replication (which starts at $1000+ and enforces per row counts). This would make periscope more valuable, but as a pure MySQL – it’s simply a pretty graph to your MySQL query with some added filters. Their linking and drilldowns are merely allowing you to click to select a filter.”
- Anonymous (Quora), April 7, 2016
(4) Speed of the Platform
The speed of Periscope Data compares with other options, and most reviewers were happy with it. But a handful of reviewers criticized the speed in specific use cases. We included these criticisms among other comments on speed.
Here’s what users said about speed:
“More speed and reliability, having our reporting/insights platform decoupled from our main stack, running on a slave database, and that improves the speed on our stack.”
- Bruno C. (G2Crowd), Aug. 22, 2018
“Constant data lag and sometimes data integrity can be an issue. We constantly met with data lag which can prevent us from setting up the best dashboard.”
- Sr. Operations Associate in the Transportation Industry (Gartner), March 8, 2019
“We rarely experience issues with loading time or data refresh.”
- Marketing Analyst in the Services Industry (Gartner), Oct. 14, 2018
“Each query to support the visualizations on the dashboards can take time to set up in a way that is fully customizable by a non-technical end user.”
- Full Stack Software Engineer in the Retail Industry (Gartner), March 16, 2019
“The cache, from Amazon, it's not the best... I don't know how to improve it but it's kind of slow, I think most of it's because it depends a lot on the DBA team.”
- Business Intelligence and Data Analytics in the Services Industry (Gartner), Oct.16, 2018
“Large tables take a lot of time to visualize and download.”
- Carla F. (G2Crowd), Feb. 11, 2019
“We had some problem with Periscope speed maybe it’s because rappi manage huge data tables. [sic]”
- Emilio M. (G2Crowd), Feb. 11, 2019
“Slow loading times.”
- Shivi G. (G2Crowd), July 30, 2018
(5) Complaints
Many of the complaints we found relate to users who probably bought Periscope Data by mistake. It seems they lacked the expertise to take full advantage of the platform's advanced features. Below are examples of the most typical complaints we found.
Here’s what Periscope Data users complained about:
“I would like more formatting options for tables, as well as more options for filtering.”
- Sr. Associate in the Transportation Industry (Gartner), Feb. 22, 2019
“Make sure you have a strong enough team proficient in SQL before deciding to rely on Periscope if you expect your BI needs to continue growing (which I guarantee they will).”
- Full Stack Software Engineer in the Retail Industry (Gartner), March 16, 2019
“We face issues with the platform not working quite a few times. The data is not visible and queries do not run well.”
“Queries break a lot of time. There are cases of data inconsistency too.”
- Head of Online Ordering in the Sales and Marketing Industry (Gartner), Nov. 13, 2018
“I had some problems trying to integrate automatically some of [the] third party informations [sic] sources. Also, sometimes it is slow … Another problem we encounter is that the R model can’t handle more than 800,000 rows. Also, a big pain for us is the output sliding mechanism...”
- Emilio M. (G2Crowd), Feb. 11, 2019
“My only real point of dissension would be that tables break inexplicably for no rhyme or reason at times and then suddenly work again.”
- Daniel W. (G2Crowd), Feb. 9, 2019
“The mobile experience is not optimal. It's hard to see the individual charts and choose filters with a mobile device, even one with a large screen. I think a stand-alone app would improve the Periscope platform.”
- Thomas K. (G2Crowd), Feb. 8, 2019
Sometimes can give you errors for larger sets of data.
- Shivi G. (G2Crowd), July 30, 2018
“It can often be difficult to manage the large number of dashboards that can be created and disseminated between teams at the company. The search option for discovering and sorting dashboards has room for improvement.”
- Shreyans P. (G2Crowd), Jan. 18, 2018
“My only complaint (in the basic version) is the lack of a security model. What they have is a bit too crude won’t doesn’t [sic] scale for most organizations. I believe this is solved in the Enterprise edition.”
- Bala Parthasarathy, CEO & Co-founder at MoneyTap, Jan. 25, 2017
(6) Customer Support
Customer support is one area where Periscope Data meets and exceeds everyone’s expectations. We couldn’t find a single complaint about Periscope Data’s customer support.
Here’s what users said:
“They have amazing support, they take care of us as a customer, and they embrace the human element. I believe business is personal, and the Periscope team clearly gets it.”
This reviewer even said that Periscope Data customer service met him for beers one afternoon to troubleshoot his support issues!
- Ben Williamson, Co-Founder at Yoshirt, 10 Years at Apple (Quora), May 26, 2016
“Professional and pro-active. From the pre-sales, sales, on boarding, implementation and support phases of working with Periscope Data.”
- Director, Partner, CIO in the Transportation Industry (Gartner), Oct. 16, 2018
“The support is amazing, they're very helpful and understanding.”
- Business Intelligence and Data Analytics in the Services Industry (Gartner), Oct.16, 2018
“They also have GREAT customer service. The Customer Success Managers are professional and are for the company's benefit, the Solutions Engineer are swift and amazing at what they do with great customer service. I loved everyone that I had a chance to talk to from Periscope Data.”
- Katherine C. (G2Crowd), Jan. 28, 2019
“The people, from the sales team to the support team, are excellent.”
- Bruno C. (G2Crowd), Aug. 22, 2018
(7) Compared to Other Products
Every time we found a review that mentioned Periscope Data compared to leading competitors, we grabbed the text for you. Many BI pros liked the fact that Periscope Data doesn’t “hold your hand,” which allowed them to customize the platform with their coding expertise. But this lack of hand-holding presented a hurdle for unskilled users.
Here’s what people said:
“I feel like this is the better big data tool vs. Tableau…”
- Digital Marketing Specialist in the Services Industry (Gartner), March 22, 2019
“Writing my own code, that does exactly what I want it to do because I wrote it, is great, as opposed to some competitor software that tries to hand-hold more tightly during the data gathering part.”
- Senior Data Scientist in the Services Industry (Gartner), Oct. 16, 2018
“It has made viewing our data neat and organized. Our previous platform is not as neat and polished as this one.”
- Claims Processor in the Healthcare Industry (Gartner), Oct. 14, 2018
“I would have evaluated many more platforms and selected one which requires less technical acumen to maintain. We have since migrated many aspects of our BI dashboards from Periscope to Looker which has already demonstrated it's potential to allow non-technical users to create their own one-off reports and monitoring visualizations for new insights without requiring the help of someone proficient in SQL.”
- Full Stack Software Engineer in the Retail Industry (Gartner), March 16, 2019
“A lot of folks use Tableau for data visualization, but Periscope is basically the combination of Tableau and SQL in one.”
- Daniel W. (G2Crowd), Feb. 9, 2019
“Periscope Data has certainly been a best-in-class product when it comes to powerful data visualization and dashboarding capabilities and has been a great tool when compared to alternatives such as Tableau and Domo.”
- Shreyans P. (G2Crowd), Jan. 18, 2018
“Chartio and Periscope are aimed at different kinds of users. Unlike a lot of other tools, Chartio enables non-SQL to transform data themselves, taking a big burden off analysts, and also simplifying implementation of BI in the organization.”
- Barry Parr, Director & Lead Analyst (Quora), May 7, 2015
“It's better (more flexible, faster, more powerful) and cheaper than Looker, Tableau, Domo...”
- Ryan P. (G2Crowd), Jan. 20, 2017
“We evaluated over 60 different visualization tools before selecting Periscope Data. If you're using Amazon Redshift (and now I believe they’ve expanded to other databases), this is by far the best choice. The others are not even close.”
- Bala Parthasarathy, CEO & Co-founder at MoneyTap, Jan. 25, 2017
Periscope Alternatives
The business intelligence space is competitive and many alternatives to Periscope Data are available. Here are three popular ones:
Tableau:
Tableau Server claims that it empowers organizations to investigate business analytics with its user-friendly, drag-and-drop interface. The easy interface is supposed to help non-tech savvy team members find valuable stats and hidden opportunities more independently.
In this respect, both Periscope and Tableau claim to do similar things. However, Periscope allows for deeper, more intelligent big data insights and requires SQL knowledge. Meanwhile, Tableau is a no-SQL solution that helps non-tech staff create automated excel reports, dashboards and visuals.
Looker:
Looker is a BI solution that falls somewhere between Tableau and Periscope in terms of the need for SQL knowledge. Although Looker requires a basic knowledge of SQL to query data and design visualizations, the software doesn’t expect you to be a BI guru. Plus, if you’re an absolute SQL beginner, Looker includes a database of learning materials and videos to bring you up to speed on SQL.
Also, unlike Periscope, Looker lets you ditch the data warehouse. According to a Looker VP, “the cool thing about the LookML layer is that it doesn't need a traditional data warehouse. It can have a simple replica of a production database.”
Chartio:
Like Tableau, Chartio is another drag-and-drop solution. Chartio writes SQL queries for team members who don't know how to code by letting them drag and drop the elements they want. You can also write your own SQL queries and share the results with Chartio.
Chartio claims that anyone can use its tools to create stunning dashboards and visualizations to share with customers and team members. The software helps you set up quick visuals, filters, drilldowns, and pivots. It even lets you create charts on a tablet or phone.
Plus, unlike Periscope, Chartio customers can bypass the need for a data warehouse to connect their databases directly to the platform for realtime reporting.
Do You Really Need the Dashboards, Widgets and “Deep, Machine-Learning Insights”?
BI services providers—like Periscope Data, et al.—are cramming as many visualizations, widgets, and machine learning analytics into their platforms as they can. It’s enough to make an SQL purist's head spin!
For those who understand the power of simple, intelligently-written SQL code, it’s tempting to say “no” to these high-cost, feature-laden solutions. Still, even an old-school SQL coder can see the tremendous value of query automation.
What if you want query automation, but don’t need the bells and whistles, fancy graphs, color-heavy visualizations, widgets, or machine learning insights? Or, what if you just don't want to pay for them? That’s where SQLBot comes in. SQLBot lets you schedule queries ahead of time, and push the results automatically to your team via Slack (hourly, daily, monthly, yearly, whenever you want).
Even better, SQLBot costs $0/month (for one team member, two reports and 150 slack messages per month). If you want more users and reports, the higher tiers are just $99/month and $299/month depending on your need.

Conclusion: Periscope is Excellent (If You Really Need)
After our deep dive into Periscope Data, we can finally answer the question, is it "the most powerful, flexible analytics platform for data professionals and business users?" It very well could be. In this constantly-changing market, Periscope Data is a flagship, cutting-edge solution in a highly competitive space. The customer service is excellent, and the big data insights could drive your business to higher profits.
But can you afford the high costs associated with the BI team and data warehouse required to set up and manage your Periscope platform? And do you really need all the features?
If your business model relies on machine learning and big data analytics, Periscope is worth the cost. Otherwise, a simpler solution like SQLBot is more in line with what you need.
Data Warehouse Info


Recently added reviews


Try Xplenty
The ELT Tool Built for the Cloud
The ELT Tool Built for the Cloud
Unlimited Connectors | Unlimited Pipelines | 14 Day Free Trial