New Relic: Overview and Review
Ever had to dive into a vast archive of logs or repository to determine why your server went down? Or trace the source of an error during testing runs or try to reproduce errors that occurred in production issues? Or identify performance bottlenecks that only show up in production environments? All without having to replicate the entire set-up in a test environment.

If you’ve ever been in any of the above scenarios, then you may have appreciated the help of New Relic’s robust application monitoring solution.
Things to Consider Before Choosing an APM
APM solutions enable you to:
- Track key transactions and
- Narrow down where bottlenecks, vulnerabilities,
and errors are happening within your application environment.
These solutions also come with error
Whether you’re part of a software dev team trying to create robust applications. Or a C-suite executive trying to make data-driven business decisions. Application monitoring solutions can help you visualize performance across all boards.
Ideally, you would need a suite of solutions to help track everything from your applications down to the servers. APM solutions help collate, store and analyze application data. Such analysis helps developers spot trends in error rates and response times. And also aids in the creation of high-performance, stable applications.
Like all other products, APM solutions aren’t designed to cater to all types and sizes of business. Your particular use case affects the choice of an APM solution.
- Do you require a simple, intuitive and
easy-to-use solution with essential features? - Do you need one or two dashboards that deliver only
the most critical metrics? - Or do you prefer an advanced solution that
contains sophisticated modules and dashboards? Specifically designed for useby large enterprises and very skilled personnel.
You should also look out for specific features that are indispensable to your industry and particular use case. To help you make this choice, we’ve put together a review of New Relic’s monitoring solutions.
New Relic
New Relic has a full suite of monitoring solutions with various capabilities. All of which help enterprises:
- Detect user-facing issues,
- Improve the quality of their code,
- Attain powerful performance insights,
- And enhance browser-side performance.
One of the largest players in the APM industry is New Relic. Founded in 2008, they offer several products for:
- Real-time analytics
- Production monitoring,
- Application development,
- Cloud migration,
- Mobile application management,
- And infrastructure monitoring.
Currently, over 17,000 businesses rely on New Relic’s
- MySQL
- Amazon Web Services
- NGINX
- HAProxy,
- And Elasticsearch.
Features
APM (Application Performance Monitoring)
APM is New Relic’s flagship product and supports the following languages: Go, Node.js, Python, .NET, Java, PHP, and Ruby. Monitoring an application requires the installation of the applicable agent. Let’s take a look at how you can use the APM solution to monitor your applications.

Installing an agent
The Python agent supports Django and other common frameworks. Enabling it to pick up various operations and transactions and measure the response time. To use this agent, you should:
- install a
newrelic package, - execute the command that generates the configuration file,
- and fire up the application.
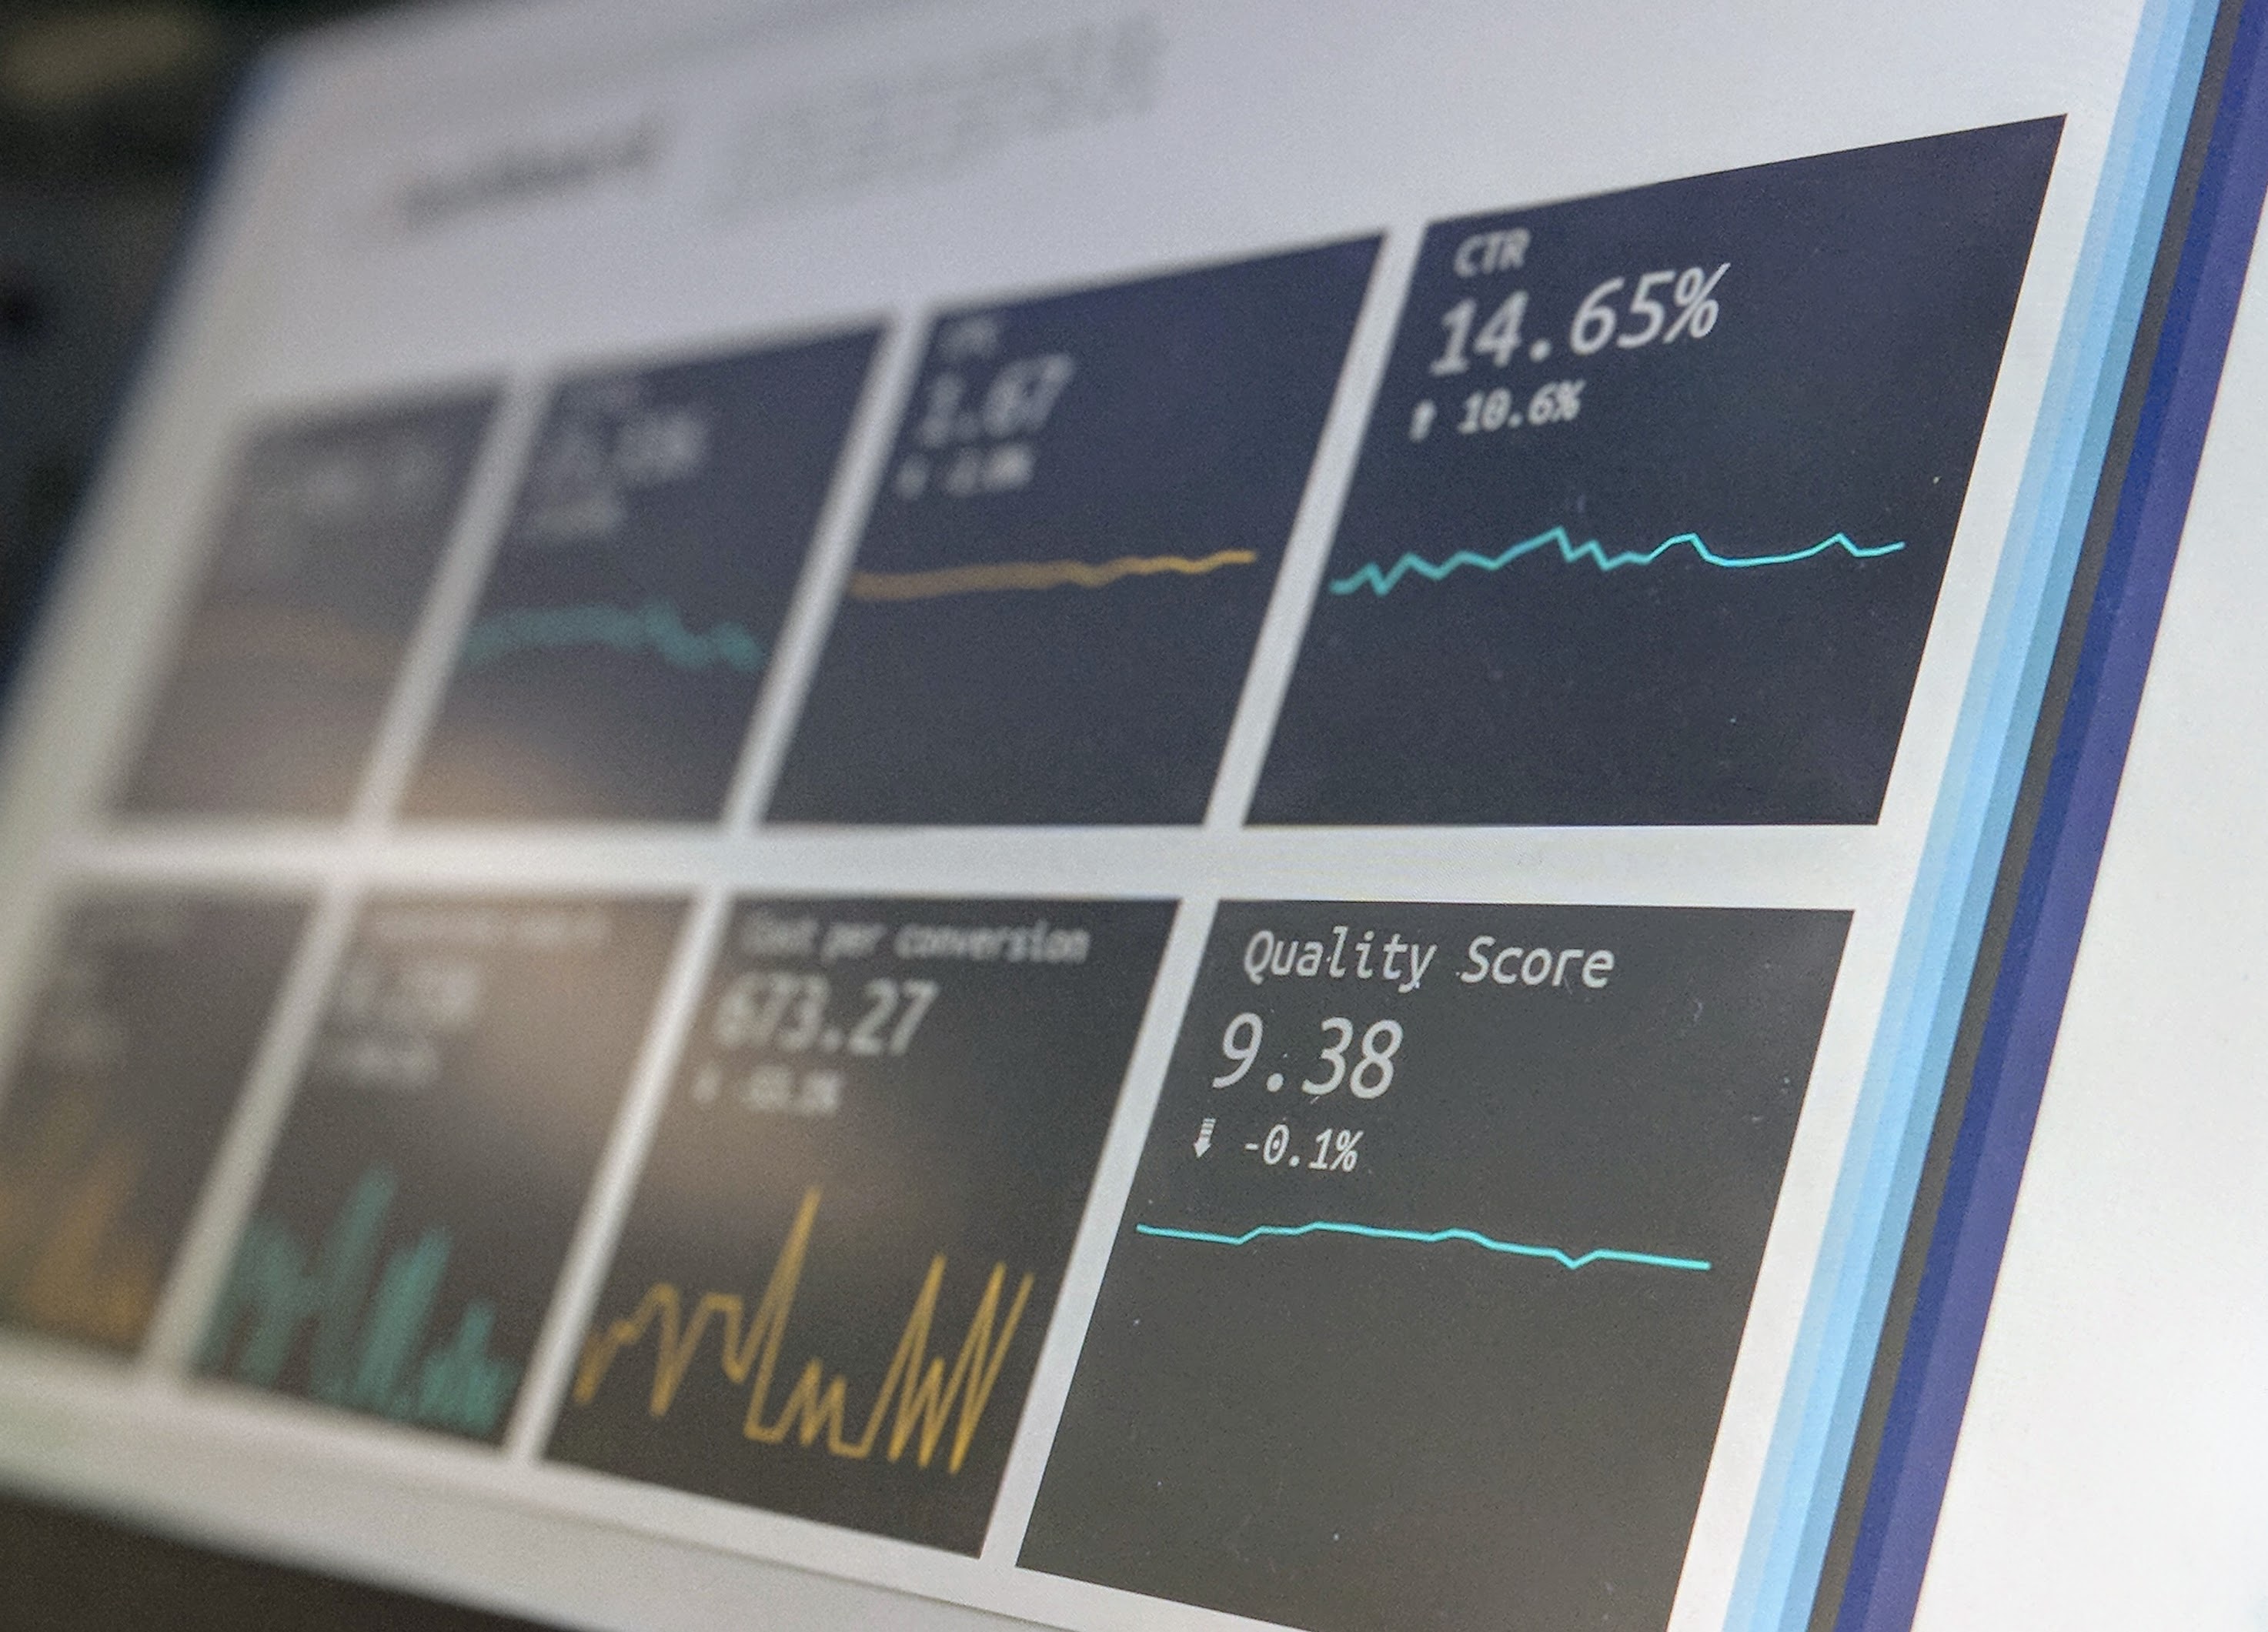
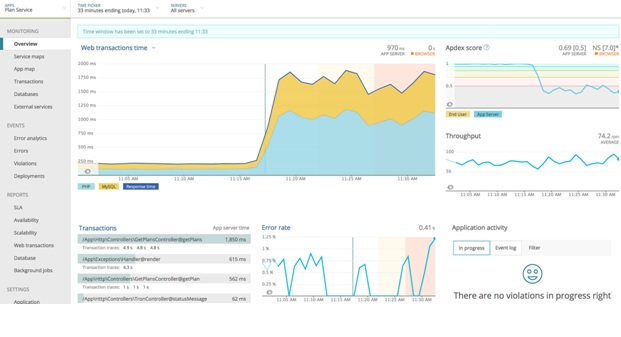
Once you install and run the agent, it will start picking up performance information about your application. Then it will report them on New Relic’s app interface. You can then view a detailed analysis of throughput, latency, Apdex scores and other metrics on an overview dashboard within a few minutes.
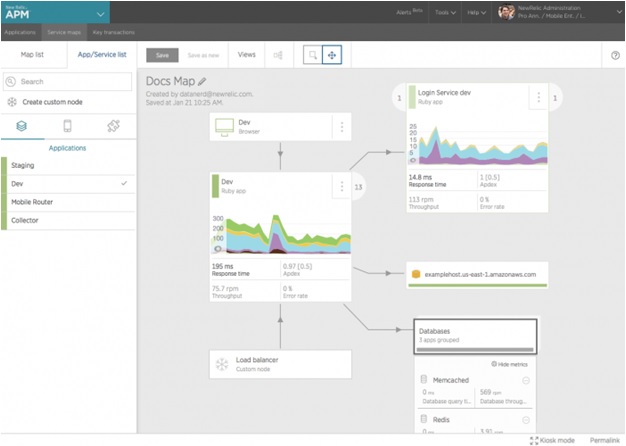
Service Maps
One very useful aspect of the APM solution is its Service maps feature. This provides a detailed visualization of all your architectural components in one place. It helps you understand how they fit together. This is useful for dev teams working on applications with lots of moving parts and several dependencies. Also, you can navigate to the dashboard of a particular service from within the map.
Mobile Application Management
This is one of the few products designed to help mobile developers analyze and improve on app performance times. It lets you
Application Development
New Relic helps tear down the walls between IT and Dev/Ops, breaking each out of its siloed existence and enabling end-to-end visibility. You can identify bugs and performance issues through monitoring real-time deployment markers. These indicate before and after performance metrics. New Relic’s dashboards help you to analyze the history of deployments. To better understand the impact on response time, throughput and end-user satisfaction.
Alerting
New Relic
Apdex Score
New Relic delivers results based on the Apdex score
Unless you understand how the Apdex score works. And are able to choose a sensible T-value (that makes sense for your particular use case). You’ll be unable to understand and leverage the information shown on New Relic’s dashboards and pre-configured alerts.
Pricing
Although New Relic is the most well-known APM solution on the market. And they offer a full suite of products for synthetic and application performance monitoring. Some companies aren’t thrilled with its pricing.
Pricing depends on a variety of factors. Making it difficult to predict or estimate just how much you're going to spend.
You can register for a free version. But using some of the more advanced functionalities requires upgrading to a paid, premium account. Investing in all the features that you need can get expensive. Especially for smaller companies on a budget.
Synthetics pricing is $69 per month while APM pricing per host ranges from $9.37 to $200 per month (billed annually). Both solutions come with a 14-day free trial for the Pro version. The actual price you pay will depend on:
- The total number of hosts/instances,
- Size of each host/instance,
- And the number of hours using each host/instance
This does make it unsustainable for microservices.
What New Relic Customers Have To Say
To help you determine if New Relic’s APM solution is a good fit, let’s take a look at some user reviews from around the world.
According to Matthew M. on a G2Crowd review, he says that New Relic is “Simple & Intuitive.” He then goes on to say:
“[New Relic] gives detailed performance metrics for every aspect of the environment, in real-time. I love the amount of detail I can receive on very detailed aspects of my software. I am able to view app performance down to specific lines of code. This
allow me to see [lines of connected code],effecting and the resources [used].”
Ashley S., another reviewer on G2Crowd, says that it “helps my team stay on top of all of our apps.” Followed by:
“I like that New Relic keeps me in the loop in regards to what’s happening with the applications my team as created.”
But she does mention that “I’m a newer user so sometimes I find New Relic a bit overwhelming. I like what it does, but haven’t figured out all of the places that I need to go in order to find what I’m looking for.”
And, lastly, Ahmed W, says that “[New Relic] doesn’t just ‘monitor’ different aspects of our work, but it also connects them in a comprehensive union... I like that it didn’t take me days to set it up,” in his G2Crowd review.
Alternatives
Traceview
Traceview allows you visualize the full application stack within an intuitive dashboard. You can understand your apps' performance at a granular level by analyzing the dips, spikes, and trends in each graph. It enables in-depth analysis of all application components. Dialing down into every request/query and identifying the script or query causing performance issues. Traceview mainly differs from New Relic in terms of pricing. There is a free version that enables access to 1 user, 1 application and up to 5 hosts. While the paid Enterprise Host package (with unlimited users and applications) costs $39.50 per month or $19 per GB (paid annually).
Pingdom Server Monitor

Pingdom Server Monitor comes with a robust list of plugins that support a wide range of software and add-ons. Enabling you to monitor your critical apps and supporting stack infrastructure in a single solution.
It delivers superior response times when compared with New Relic. And offers users significantly less overhead. Pingdom prices its server monitoring solution at $9/month for each server. And delivers:
- Up to one-second resolution,
- role-based management,
- Dashboards,
- SMS alerting,
- One-year data retention,
- And many other capabilities.
Scout

Scout provides monitoring for the modern development team. This platform leverages tools, such as Github, PaaS services, and dynamic languages. All of which help “big things get done.” Scout will help your dev team figure out what your performance outliers are. Unlike other legacy APM tools.
Scout has affordable pricing for both small ($99/month) and large ($299/month) teams. Their platform runs on Ruby,
Conclusion
If you need monitoring application performance across multiple servers. Along with MySQL database clusters. You may need New Relic’s APM tool. The APM solution is the strongest and most popular product in New Relic’s suite of monitoring tools.
- It supports several languages and frameworks
- Delivers optimal functionality
- Drilled down visualizations and the installation process is a breeze.
You can click here to register for a free trial of New Relic’s suite of application monitoring solutions.
About DataWarehouse4u.info
For more content about the latest technology and tools, check out Datawarehouse4u.info. We post reviews, advice, and tutorials on the technology you want to learn more about.
Don’t miss out on the latest tech info!
About the author:
Chris Diamond is a technology journalist with 6+
Data Warehouse Info


Recently added reviews


Try Xplenty
The ELT Tool Built for the Cloud
The ELT Tool Built for the Cloud
Unlimited Connectors | Unlimited Pipelines | 14 Day Free Trial